
Review of Business and Economics Studies, 2015, том 3, № 2
Покупка
Основная коллекция
Тематика:
Экономика. Бухгалтерский учет. Финансы
Наименование: Review of Business and Economics Studies
Год издания: 2015
Кол-во страниц: 68
Дополнительно
Вид издания:
Журнал
Артикул: 705314.0001.99
Тематика:
ББК:
УДК:
ГРНТИ:
Скопировать запись
Фрагмент текстового слоя документа размещен для индексирующих роботов.
Для полноценной работы с документом, пожалуйста, перейдите в
ридер.
Review of
Business and
Economics
Studies

EDITOR-IN-CHIEF
Prof. Alexander Ilyinsky
Dean, International Finance Faculty,
Financial University, Moscow, Russia
ailyinsky@fa.ru

EXECUTIVE EDITOR
Dr. Alexander Kaffka

EDITORIAL BOARD

Dr. Mark Aleksanyan
Adam Smith Business School,
The Business School, University
of Glasgow, UK

Prof. Edoardo Croci
Research Director, IEFE Centre for
Research on Energy and Environmental
Economics and Policy, Università
Bocconi, Italy

Prof. Moorad Choudhry
Dept.of Mathematical Sciences, Brunel
University, UK

Prof. David Dickinson
Department of Economics, Birmingham
Business School, University of
Birmingham, UK

Prof. Chien-Te Fan
Institute of Law for Science and
Technology, National Tsing Hua
University, Taiwan

Prof. Wing M. Fok
Director, Asia Business Studies, College
of Business, Loyola University New
Orleans, USA

Prof. Konstantin P. Gluschenko
Faculty of Economics, Novosibirsk State
University, Russia

Prof. George E. Halkos
Associate Editor in Environment and
Development Economics, Cambridge
University Press; Director of Operations
Research Laboratory, University of
Thessaly, Greece

Dr. Christopher A. Hartwell
President, CASE - Center for Social and
Economic Research, Warsaw, Poland

Prof. S. Jaimungal
Associate Chair of Graduate
Studies, Dept. Statistical Sciences
& Mathematical Finance Program,
University of Toronto, Canada

Prof. Bartlomiej Kaminski
University of Maryland, USA;

Rzeszow University of Information
Technology and Management,
Poland

Prof. Vladimir Kvint
Chair of Financial Strategy, Moscow
School of Economics, Moscow State
University, Russia

Prof. Alexander Melnikov
Department of Mathematical and
Statistical Sciences, University of
Alberta, Canada

Prof. George Kleiner
Deputy Director, Central Economics and
Mathematics Institute, Russian Academy
of Sciences, Russia

Prof. Kwok Kwong
Director, Asian Pacifi c Business
Institute, California State University, Los
Angeles, USA

Prof. Dimitrios Mavrakis
Director, Energy Policy and
Development Centre, National and
Kapodistrian University of Athens,
Greece

Prof. Steve McGuire
Director, Entrepreneurship Institute,
California State University, Los Angeles,
USA

Prof. Rustem Nureev
Head of the Department of Economic
Theory, Financial University,
Russia

Dr. Oleg V. Pavlov
Associate Professor of Economics and
System Dynamics, Department of Social
Science and Policy Studies, Worcester
Polytechnic Institute, USA

Prof. Boris Porfi riev
Deputy Director, Institute of Economic
Forecasting, Russian Academy of
Sciences, Russia

Prof. Svetlozar T. Rachev
Professor of Finance, College of
Business, Stony Brook University, USA

Prof. Boris Rubtsov
Chair of Financial Markets and
Financial Engineering, Financial
University, Russia

Dr. Minghao Shen
Dean, Center for Cantonese Merchants
Research, Guangdong University of
Foreign Studies, China

Prof. Dmitry Sorokin
Deputy Rector for Research, Financial
University, Russia

Prof. Robert L. Tang
Vice Chancellor for Academic, De La
Salle College of Saint Benilde, Manila,
The Philippines

Dr. Dimitrios Tsomocos
Saïd Business School, Fellow in
Management, University of Oxford;
Senior Research Associate, Financial
Markets Group, London School
of Economics, UK

Prof. Sun Xiaoqin
Dean, Graduate School of Business,
Guangdong University of Foreign
Studies, China

REVIEW OF BUSINESS
AND ECONOMICS STUDIES
(ROBES) is the quarterly peerreviewed scholarly journal published
by the Financial University under
the Government of Russian
Federation, Moscow. Journal’s
mission is to provide scientifi c
perspective on wide range of topical
economic and business subjects.

CONTACT INFORMATION
Financial University
Oleko Dundich St. 23,
123995 Moscow
Russian Federation
Telephone: +7(499) 277-28-19
Website: www.robes.fa.ru

AUTHOR INQUIRIES
Inquiries relating to the
submission of articles can be sent
by electronic mail to robes@fa.ru.

COPYRIGHT AND PHOTOCOPYING
© 2015 Review of Business and
Economics Studies. All rights
reserved. No part of this publication
may be reproduced, stored
or transmitted in any form or by any
means without the prior permission
in writing from the copyright holder.
Single photocopies of articles may
be made for personal use as allowed
by national copyright laws.
ISSN 2308-944X
Вестник
исследований
бизнеса и
экономики

ГЛАВНЫЙ РЕДАКТОР
А.И. Ильинский, профессор, декан
Международного финансо вого факультета Финансового университета

ВЫПУСКАЮЩИЙ РЕДАКТОР
А.В. Каффка

РЕДАКЦИОННЫЙ СОВЕТ

М.М. Алексанян, профессор Бизнесшколы им. Адама Смита, Университет
Глазго (Великобритания)

К. Вонг, профессор, директор Института азиатско-тихоокеанского бизнеса
Университета штата Калифорния,
Лос-Анджелес (США)

К.П. Глущенко, профессор экономического факультета Новосибирского
госуниверситета

С. Джеимангал, профессор Департамента статистики и математических финансов Университета Торонто
(Канада)

Д. Дикинсон, профессор Департамента экономики Бирмингемской бизнесшколы, Бирмингемский университет
(Великобритания)

Б. Каминский, профессор,
Мэрилендский университет (США);
Университет информационных
технологий и менеджмента в Жешуве
(Польша)

В.Л. Квинт, заведующий кафедрой
финансовой стратегии Московской
школы экономики МГУ, профессор
Школы бизнеса Лассальского университета (США)

Г. Б. Клейнер, профессор, член-корреспондент РАН, заместитель директора Центрального экономико-математического института РАН

Э. Крочи, профессор, директор по
научной работе Центра исследований
в области энергетики и экономики
окружающей среды Университета
Боккони (Италия)

Д. Мавракис, профессор,
директор Центра политики
и развития энергетики
Национального университета
Афин (Греция)

С. Макгвайр, профессор, директор Института предпринимательства
Университета штата Калифорния,
Лос-Анджелес (США)

А. Мельников, профессор
Депар та мента математических
и ста тистических исследований
Университета провинции Альберта
(Канада)

Р.М. Нуреев, профессор, заведующий
кафедрой "Экономическая теория"
Финансового университета

О.В. Павлов, профессор
Депар та мента по литологии
и полити ческих исследований
Ворчестерского политехнического
института (США)

Б. Н. Порфирьев, профессор,
член-корреспондент РАН, заместитель директора Института
народнохозяйственного прогнозирования РАН

С. Рачев, профессор Бизнес-колледжа Университета Стони Брук
(США)

Б.Б. Рубцов, профессор, заведующий
кафедрой "Финансовые рынки и финансовый инжиниринг" Финансового
университета

Д.Е. Сорокин, профессор, членкорреспондент РАН, проректор
Финансового университета
по научной работе

Р. Тан, профессор, проректор
Колледжа Де Ла Саль Св. Бенильды
(Филиппины)

Д. Тсомокос, Оксфордский университет, старший научный сотрудник
Лондонской школы экономики (Великобритания)

Ч.Т. Фан, профессор, Институт
права в области науки и технологии,
национальный университет Цин Хуа
(Тайвань)

В. Фок, профессор, директор по
исследованиям азиатского бизнеса Бизнес-колледжа Университета
Лойола (США)

Д.Е. Халкос, профессор, Университет
Фессалии (Греция)

К.А. Хартвелл, президент Центра
социальных и экономических исследований CASE (Польша)

М. Чудри, профессор, Университет
Брунеля (Великобритания)

Сун Цяокин, профессор, декан Высшей школы бизнеса Гуандунского
университета зарубежных исследований (КНР)

М. Шен, декан Центра кантонских
рыночных исследований Гуандунского университета (КНР)

Издательство Финансового
университета
123995, Москва, ГСП-5,
ул. Олеко Дундича, 23,
комн. 105
Тел. 8 (499) 277-28-19.
Интернет: www.robes.fa.ru.

Журнал "Review of Business and
Economics Studies" ("Вест ник
исследований бизнеса и экономики") зарегистрирован
в Федеральной службе по надзору в сфере связи, информационных технологий и массовых
коммуникаций 9 июля 2013 г.
Свидетельство о регистрации
ПИ № ФС77-54658.

Подписано в печать: 19.06.2015.
Формат 60 × 84 1/8.
Заказ № 593 от 17.07.2015.
Отпечатано в ООП Издательства
Финуниверситета
(Ленинградский проспект, д. 49).
16+
CONTENTS

Editorial

Alexander Didenko . . . . . . . . . . . . . . . . . . . . . . . . . . . . . . . . . . . . . . . . . . . . . . . . . 5

Using Intrinsic Time in Portfolio Optimization

Boris Vasilyev . . . . . . . . . . . . . . . . . . . . . . . . . . . . . . . . . . . . . . . . . . . . . . . . . . . . . 7

Is There a Dividend Month Premium? Evidence from Japan

Cong Ta  . . . . . . . . . . . . . . . . . . . . . . . . . . . . . . . . . . . . . . . . . . . . . . . . . . . . . . . . 15

Analysis of Investors’ Strategies Using Backtesting and DEA Model

Dina Nasretdinova, Darya Milovidova, Kristina Michailova . . . . . . . . . . . . . . . . . . . 21

Using Elliott Wave Theory Predictions as Inputs

in Equilibrium Portfolio Models With Views

Nurlana Batyrbekova . . . . . . . . . . . . . . . . . . . . . . . . . . . . . . . . . . . . . . . . . . . . . . . 33

Some Stylized Facts about Analyst Errors

Oleg Karapaev  . . . . . . . . . . . . . . . . . . . . . . . . . . . . . . . . . . . . . . . . . . . . . . . . . . . 46

Productivity Spillovers from Foreign Direct Investment in Vietnam

Thu Trang Le  . . . . . . . . . . . . . . . . . . . . . . . . . . . . . . . . . . . . . . . . . . . . . . . . . . . . 52

Exchange Rate Management in Vietnam

for Sustaining Stable and Long-Term Economic Growth

Nguyen Hai An . . . . . . . . . . . . . . . . . . . . . . . . . . . . . . . . . . . . . . . . . . . . . . . . . . . 58

Infographics: Patterns of Information Flows

Sharing and Volatility Spillovers

Valery Barmin . . . . . . . . . . . . . . . . . . . . . . . . . . . . . . . . . . . . . . . . . . . . . . . . . . . . 67

Review of
Business and
Economics
Studies

Volume 3, Number 2, 2015
CОДЕРЖАНИЕ

От редакции

Александр Диденко . . . . . . . . . . . . . . . . . . . . . . . . . . . . . . . . . . . . . . . . . . . . . . . . 5

Использование внутреннего времени ценовых рядов

в портфельной оптимизации

Борис Васильев  . . . . . . . . . . . . . . . . . . . . . . . . . . . . . . . . . . . . . . . . . . . . . . . . . . . 7

Существует ли премия дивидендного месяца? Пример из Японии

Конг Та  . . . . . . . . . . . . . . . . . . . . . . . . . . . . . . . . . . . . . . . . . . . . . . . . . . . . . . . . 15

Анализ стратегий инвесторов с помощью

использования бэктеста и DEA-модели

Дина Насретдинова, Дарья Миловидова, Кристина Михайлова  . . . . . . . . . . . . 21

Использование предсказаний волновой теории Эллиотта

в моделях равновесных портфелей с суждениями

Нурлана Батырбекова  . . . . . . . . . . . . . . . . . . . . . . . . . . . . . . . . . . . . . . . . . . . . 33

Несколько стилизованных фактов об аналитических ошибках

Олег Карапаев . . . . . . . . . . . . . . . . . . . . . . . . . . . . . . . . . . . . . . . . . . . . . . . . . . . 46

Переливы продуктивности от прямых иностранных

инвестиций во Вьетнаме

Тху Чанг Ле  . . . . . . . . . . . . . . . . . . . . . . . . . . . . . . . . . . . . . . . . . . . . . . . . . . . . . 52

Управление обменным курсом для поддержки стабильности

экономического роста во Вьетнаме

Нгуен Хаи Ань . . . . . . . . . . . . . . . . . . . . . . . . . . . . . . . . . . . . . . . . . . . . . . . . . . . 58

Инфографика: разделение информационных потоков

и переливы волатильности

Валерий Бармин  . . . . . . . . . . . . . . . . . . . . . . . . . . . . . . . . . . . . . . . . . . . . . . . . . 67

Вестник
исследований
бизнеса и
экономики

№ 2, 2015
Review of Business and Economics Studies

Volume 3, Number 2, 2015

Editorial*

*От редакции.

Importance of information value issues in finance and
economics can hardly be overestimated. Information is
reflected (or not) in market prices; price itself could be
used to predict major turmoils in economy; information
use (or misuse) determines asset managers performance
(or underperformance); market participants use
information about central banks’ actions and econometric
links between major macroeconomic variables to form
their expectations about inflation and exchange rates;
investment bankers use information about firm’s past
fundamentals to hypothesize on its future value; local
fi rms can learn from actions of multinational enterprises –
i.e. copy information – to increase productivity, etc.
Coincidence or not, but each paper in the current, 7th, issue
of Review of Business and Economic Studies is somehow
related to various aspects of the information impact on
performance of fi rms, markets, its actors, and economy as a
whole. And this is the reason why we’ve chosen to dedicate
infographics on the second page of the cover to the topic of
stock market information fl ows impact on each other. The
model, outputs of which are visualized by Valery Barmin,
allows to capture some aspects of information sharing
regime changes as a result of crises. In fact, during major
economic turmoils, regional information sets (i.e. sets
that are supposed to be relevant only for regional stocks)
become more globalized, market participants are sharing
the same news flow. We can hypothesize, that under
extreme uncertainty traders (probably, irrationally) are
looking for any additional information piece, which could
shed light on future. In turn, that leads to spontaneous
coordination of market participants, which makes assets
co-move together in times of fi nancial turmoil. Further, we
can observe some signs of habit formation: there is some
evidence, though weak, that when situation stabilizes,
information fl ow sharing decreases, but general patterns
sustain, leading to more co-movement between assets.
Assets co-movement, especially during crises,
brings its own risks, creating huge obstacle to
diversifi cation. Quality of diversifi cation is obviously
one of the most disputable topics in modern
quantitative finance. Boris Valilyev’s piece "Using
Intrinsic Time in Portfolio Optimization" in current
issue of our journal contributes to the field in two
important ways. He uses mixture of distribution
hypothesis to obtain nearly-normal returns, which
then can be used to calculate historical estimates
of market returns. His approach assumes applying
concept of intrinsic time, which became well-known
since seminal work by Clark, published in 1973 in

Econometrica1. Boris Vasilyev deforms return series
timescale across volume domain. By doing that he
obtains series, that are slightly asynchronous in time
domain, but instead synchronous in volume domain.
According to mixture of distribution hypothesis,
volume could be regarded as proxy for information
arrival process, and information is regarded as
the sum of all the forces, that drive prices. Returns
are almost normal, but can we use asynchronous
returns when building portfolio, which assumes
simultaneity in trading? Boris Vasilyev offers his
own solution to the problem; and by doing it, he, at
the same time, develops his own way of covariance
matrices robust estimation, which has solid ground
in economic science. Empirical analysis performed
by Vasilyev shows, that raw estimates of covariance
matrices, obtained through this procedure, appear
to be superior in terms of diagonality even to
shrinked estimates. Efficiency frontiers built with
these estimates strongly dominate frontiers build
using all traditional approaches. This is defi nitely a
breakthrough in portfolio management science.
Another important and disputable issue in
finance is what part of information set is reflected
in prices. Ta Cong in his paper "Is There a Dividend
Month Premium? Evidence from Japan" discusses,
how stock market responds to news about firm’s
dividend distribution decisions. Although he uses
standard approach of building with-dividends and
without-dividends portfolios and regressing its
returns in CAPM, Fama-French and Carhart models,
his findings contradict to previous evidence. He
postulates regional differences in market reaction
to dividend announcements. Dividend payers have
always been regarded as value companies, paying
to investor a premium over growth firms; but on
Japanese market, as Ta Cong shows, dividend payers
have negative premium over dividend non-payers.
In fact, this means that information about dividends
have negative value to investors in Japanese market –
a puzzling fi nding.
The paper "Analysis of Investors’ Strategies Using
Backtesting and DEA Model" by Dina Nasretdinova,
Darya Milovidova and Kristina Michailova approaches
issues of fi rm fundamentals relevance from completely
different angle. They analyse stock market public
strategies of 30 investment "gurus", as they were
popularized in their books. These strategies use

1 Clark, P.K. (1973), "A Subordinated Stochastic Process
Model with Finite Variance for Speculative Prices", Econometrica, 41, 135–155.
Review of Business and Economics Studies

Volume 3, Number 2, 2015

various sets of fundamentals to build portfolios
of stocks. Common sense would suggest that this
information has no value at all, since strategies were
made public long ago, and all possible excess profi ts
could easily be wiped by rational arbitragers.
Approach of Nasretdinova, Milovidova and
Mikhailova assumes using simulation of trades of
famous market forecasters, inferred from description
of their strategies; their goal is to determine, which
strategy of information set usage (if any) is superior
to others. Instead of relying to one of the classic
parametric approaches (like regressing returns in
CAPM/Fama-French/Carhart, as in Ta Cong’s paper),
they use data envelopment analysis to determine
strategies’ relative superiority in multi-criterial
KPI-like sense. Authors have found, that some
strategies do demonstrate sustainable superiority in
performance, and, moreover, these strategies could be
exposed either to value or growth risks, or even both;
hence not information set itself, but the strategy
of its usage contributes to performance. We can
mention at least one seminal paper, which supports
that result from different point of view, namely
series of papers by Brinson, Hood and Beebower on
importance of investment policy of funds2.
Nurlana Batyrbekova in her paper "Using Elliott
Wave Theory Predictions as Inputs in Equilibrium
Portfolio Models With Views" uses approach,
similar to the one taken by authors of previous
piece. She studies, whether market revelations of
one of the Elliott Wave Theory proponents, Robert
Prechter, do have some real value for predicting
the market. Conceptually, she paves the way of
Brown, Goetzmann, and Kumar3, who used to
backtest predictions of Dow Theory proponent,
William Peter Hamilton. Further, she augments their
approach with Bayesian portfolio decision using
Black-Litterman portfolio optimization framework.
She fi nds that while overly concentrated, high-risk
portfolios are underperforming the benchmark,
combining predictions with diversifi cation beats both
the benchmark and diversified portfolios without
Prechter’s simulated views. Hence, Prechter’s market
ruminations, despite all the haziness and adhocism
inherent to Elliott Wave Theory, could bring some
value to market participants.
Oleg Karapaev further contributes to information
value issues in the following way. In his paper, "Some
Stylized Facts about Analyst Errors", he questions

2  Gary P. Brinson, L. Randolph Hood, and Gilbert L. Beebower, "Determinants of Portfolio Performance," Financial
Analysts Journal (1995): 133–138.
3  Stephen J Brown, William N. Goetzmann, and Alok Kumar, "The Dow Theory: William Peter Hamilton’s Track Record Reconsidered," The Journal of Finance 53, no. 4 (1998):
1311–1333.

possible reasons of low accuracy of broker sell-side
recommendations. Brokers are supposed to use all
relevant information, be it publicly available or
insider, to estimate future stock prices and market
fundamentals; they use the latter to build discounted
cash flows models, and to infer fair price from it.
Sometimes brokers fail to forecast prices; sometimes
they fail to forecast fundamentals as well. Possible
questions here could be: is there some significant
difference in forecast errors for fundamentals as
compared to prices? If so, the reason of error could be
in denominator of DCF model, i.e. in discount term,
which incorporates time-varying risks perception.
Further, are there some differences in errors across
industries or investment styles? In other words,
can we say that some fundamentals are harder to
predict due to specifi c uncertainties of the industry
or business model or fi rm lifecycle period? Do errors
of consensus forecast depend upon the number of
brokers covering the stock? This is a sketch of a grand
research programme, and Oleg Karapaev in his paper
formulates just some stylized facts and makes fi rst
attempt of conceptualization.
Le Thu Trang takes completely different angle in
"Productivity Spillovers from Foreign Direct Investment
in Vietnam", researching how information about best
practices in industry affects firm productivity and
hence – economic growth. She applies classic approach
– total factor productivity estimation through data
envelopment analysis, with subsequent regression
of panel of various factors to TFP – to Vietnamese
data, and contributes to evidences of positive impact
of foreign direct investments by multinational
corporations on local industries.
Finally, we close the 7th issue of ROBES with
paper "Exchange Rate Management in Vietnam for
Sustaining Stable and Long-Term Economic Growth"
by Nguyen Hai An. His findings are complementary
to results of Le Thu Trang. Nguyen Hai An builds
macroeconometric model linking inflation and
trade balance with exchange rate, price for credit,
and money supply. Author fi nds that while currency
depreciation impacts inflation, information about
exchange rate alone could not explain trade balance
change. Hence, policy advice could be inferred, that
government should focus on stabilizing exchange
rate to make inflation more predictable for firms,
and on enhancing the quality of exported goods to
improve fi rms competitiveness. Probably, that could be
achieved, among other measures, by creating stimuli
for multinational enterprises to be more active in
direct investments to industries.
Alexander DIDENKO, Ph.D.
Head of Research Planning and Support
Financial University, Moscow
Review of Business and Economics Studies

Volume 3, Number 2, 2015

INTRODUCTION

Soon after the publication of "Portfolio Selection" by
Harry Markowitz (1952) that is mostly referred to as
a seminal work for modern portfolio theory based on
mean-variance analysis (referred herein after to as
"MVO"), it became evident that the original method
presented therein resulted in low-diversifi ed and unstable portfolios leading to overtrading and excessive
risks. Along with increasing the number of assets in
optimization universe these drawbacks even aggravated, and that most probably motivated Markowitz to introduce initial linear constraints to the process which
were described in his work (1956) published several
years later and gave ground to numerous modifi cations
and developments to the MVO process ever since.

OVERTRADING

With respect to MVO excessive trading activity is
mainly stemmed from frequent portfolio rebalancing

that leads to placing additional open or close market
orders to meet new assets allocation. A major cause
of such instability is a combination of factors comprising unavoidable presence of estimation errors
within input data from one hand, and high sensitivity of MVO to even minor changes in inputs, from
the other. Hypothetically, if input data would be free
of such errors inside, the optimization would definitely provide effi cient or optimal portfolio composition. In reality the inputs are statistical estimates
derived from or generated on the basis of historical
data and bear some portion of disturbance inside.
Michaud (1986) posited such inaccuracy results in
overinvestment in some securities or assets and underinvestment in others. For example, with two assets like A and B, such as A’s true expected return is
slightly lower than that of B, but standard deviation
is slightly higher, and provided both assets returns
have identical correlations with the returns for each
of the other assets the portfolio universe, asset B is
preferred among these two, and if the inputs are free

Using Intrinsic Time
in Portfolio Optimization*

Boris VASILYEV
International Financial Laboratory, Financial University, Moscow
b_va@hotmail.com

Abstract. The concept of intrinsic time was introduced in Mandelbrot’s paper circa 1963 and further developed
in discussion paper by Muller et al. (1993).  As reported by Didenko et al. (2014), there are some evidences
that sampling price series in volume domain results in almost normal returns, which could help to overcome
some common issues in portfolio optimisation. First, we briefl y survey fl aws of classic approach to portfolio
optimisation, then we test for statistical properties of intrinsic-time sampled return series, theorize on how
intrinsic time could help in handling issues of portfolio optimisation, and then empirically test our guesses. We
show that using intrinsic time helps in overcoming such fl aws of Modern Portfolio Theory as poor diversifi cation
and reliance on normality of returns.

Аннотация. Концепция внутреннего времени была введена в работе Mandelbrot 1963 года и далее
развита в докладе Muller с соавторами (1993). Недавнее исследование Диденко с соавторами (2014)
предоставило  ряд свидетельств о том, что свертка ценовых рядов по объемам приводит к квазинормальности доходностей активов. Этот феномен можно использовать в портфельной оптимизации.
Наша работа начинается с краткого обзора основных проблем современной портфельной теории. Далее мы
тестируем нормальность рядов при различных параметрах свертки по объемам и эмпирически тестируем
пригодность такой свертки в портфельной оптимизации. Наши результаты показывают, что свертка
по объемам позволяет преодолеть такие недостатки СПТ, как слабая диверсификация и предположение
о нормальности доходностей.

Key words: Intrinsic time, modern portfolio theory, portfolio optimisation, returns normality.

* Использование внутреннего времени ценовых рядов в портфельной оптимизации.
Review of Business and Economics Studies

Volume 3, Number 2, 2015

of estimation error, it dominates A. But if such errors
resides the input data, asset A may have an estimated expected return that is higher, and an estimated
standard deviation hat is lower than that of B. In this
case, portfolio optimization will erroneously assign a
higher weight for A than for B. Moreover, estimation
error may fl uctuate around zero over time, and having
the same true expected values for A and B in future,
the optimizer may generate the opposite result affected by changing estimation error that will lead to
dramatic rebalancing of portfolio.
High MVO sensitivity to a minor change in the
data for input can therefore lead to a dramatic change
in overall portfolio composition. Thus, an update that
bears a slight change in expected return or standard
deviation for one asset can result in radical portfolio
reconstruction, rebalancing weight not only for this
particular asset, but reallocating all the assets from
the universe under consideration. Such potential recomposition results in excessive trading on the portfolio deemed necessary to meet new allocations each
time the inputs change.
Overtrading is usually associated with two main
problems such as increased possibility of capital loss
and excessive transaction costs. First mainly results
from overinvestment in few assets that is evident for
low-diversifi ed concentrated portfolios. The inputs
for MVO are always estimates that may be quite far
from the true values in future. Thus, if the market
turns against the investor, low portfolio diversifi cation, i. e. allocation into fewer assets, will increase
potential losses. In this case if the investor utilizes
the leverage the losses are even magnifi ed and may
exceed investor’s capital. Another issue is transaction
costs. They are often fi xed, and in total therefore dependant on the number of trades executed. Frequent
assets re-allocation results in higher transaction
costs that harmfully affect the return of the portfolio
and hence overall profi tability of the investment.
The problem of excessive turnover and overinvestment in fewer assets can be settled by introduction
of specifi c constraints into MVO process. These may
limit minimum and maximum weights for one asset
(or class of assets) and/or preset minimum number of
assets to be included in the portfolio to ensure proper
level of its diversifi cation.
Transaction costs may be reduced by composition
of more stable portfolios. For example, Lummer et
al. (1994) proposed for this purpose to use sensitivity analysis allowing to diminish dramatic changes in
recommended portfolio due to minor changes in inputs. This method implies selecting an effi cient portfolio and then altering the MVO inputs to construct
a set of portfolios with new inputs, and then to examine how close they are to the initial effi cient one.

The goal is to fi nd a set of asset weights that will be
close to effi cient proportion under several different
sets of plausible inputs. On the other hand, expected
benefi t from any reallocation advised by MVO can be
assessed with respect to relevant transaction costs
necessary for its execution.

EXPECTED RETURNS

Yet another question for MVO is that the theory implies expected returns as an input. They cannot be
known directly from the market, but only estimated
commonly on the basis of its past data, that leads to
unstable portfolio weights. MVO would generate a
perfect solution if the inputs would be true expected
returns and the variance matrix. In reality the estimates of expected returns mostly consist of noise
and estimates of the variance matrixes are very
noisy too. Scherer (2002) noted that "mean-variance
optimization is too powerful tool for the quality of
our data".
The main problem is to estimate expected returns with suffi cient accuracy. There are several main
methods published to resolve this issue. For example,
Black and Litterman (1992) proposed to estimate the
expected returns by combining Capital Asset Pricing
Model (CAPM) equilibrium and subjective investor
views. However, investor’s assumptions for the market must be also specifi ed with numbers for both the
expected returns and the uncertainty that may be
considered as a drawback for this approach. Another
way is the Arbitrage Pricing Theory (APT) that was
described by Ross (1976) and was intended to model
returns of the assets (for the discrete time) as a linear
combination of independent factors. The APT constructs expected returns as statistical estimates to fi t
historical data that in turn may also lead to unstable
allocations.
Another empirical way of expected returns estimation is to apply for consensus forecasts of professionals participating in market activity. Informational
vendors (such as Bloomberg) provide this opportunity
to its subscribers. However, the experience proves
their expectations are usually drop far from true values, at least as far as single assets predicts are concerned. Meanwhile, the empirical expectations with
respect to cumulative indexes prove to be much more
accurate. This allows to use a single index model as
an instrument of expected return estimations using
index estimation as the only macroeconomic parameter to influence particular asset expected return.
Multifactor models are not that simplifi ed and imply
regression analysis based on several factors such as,
for example, indexes by various industry sectors. They
are more detailed in assessment of expected returns
Review of Business and Economics Studies

Volume 3, Number 2, 2015

than single index models as consider any stock dependence not on general index, but on the index of
corresponding sector. However, multifactor models
also provide quite rough estimations within wide
confi dence intervals.
Following MVO routine, once input parameters
have been estimated, it performs optimization assuming all inputs are certain and estimation errors
are introduced into the process of allocation. Various
approaches exist to stabilize the optimization results
with respect to estimation errors, which can be distinguished in two main ways.
The fi rst approach implies to reduce the estimation errors of the input parameters via econometric
methods. For example, to reduce the impact of noise
estimation Michaud (1998) used the resampling
method. The idea behind it is that real returns are
very noisy. As the optimization procedure is very
unstable depending on small changes in inputs, the
portfolio should be optimized over sets of similar
return series that are randomly generated following
some preset parameters. On average, noise should be
evened out. Thus, starting with original return series,
some new series are generated with small amounts
of noise to the original series. Then MVO procedure
runs over all series and eventually results in a set
of different optimal portfolios composed for a same
expected returns level. The average over all optimal
portfolios is expected to be more stable with respect
to errors in the input data.
The second way is to shrink directly the weights
in portfolio using bounds, penalties for the objective function or regularization of input parameters.
Jagannathan and Ma (2003) showed that imposing
constraints on the mean-variance optimization can
be interpreted as a modification of the covariance
matrix. In particular, lower (upper) bounds decrease
(increase) the variances of asset returns. Thus, constraints imposed on weights can reduce the degree
of freedom of the optimization, and the allocation
remains then within certain intervals. But the correction of estimation errors proved to be such difficult task that some studies were devoted to show
that heuristic allocations perform even better than
MVO-generated ones with respect to Sharpe ratio.
For example, DeMiguel et al. (2009) assessed the performances of 14 different portfolio models and the
equally-weighted portfolio on different datasets and
come to conclusion that detailed and sophisticated
models did not produce a better optimization than
the naïve equally-weighted portfolio.
As a result, Lindberg (2009) mentioned one more
way to deal with the problem of expected returns estimation that is simply ignoring them. This method
is stemmed from the classical 1/n strategy, which

simply puts 1/n of the investor’s capital in each of
n available assets. No doubt, this strategy should be
well diversified. However, covariation between different assets may refrain this from being the case,
and as it is possible to obtain rather good estimates
of covariations between assets returns, this information can be also used in portfolio construction. Later,
Fernholz (2002) has proposed to consider expected
returns as dependant on ranks. These ranks can be
established, for example, based on the market capital distribution. Thus, rank 1 can be assigned to the
asset with the highest market capitalization, rank 2
to the next highest, and so far. A paper by Almgren
and Chriss (2005) presented a portfolio optimization method which utilized such ordering information instead of expected returns. It uses information
about the order of the expected returns as the MVO
inputs instead of the very estimates. This approach
also benefi ts from extended use of covariance information.

NORMALITY OF RETURNS

Assets returns follow some statistical distribution
and its form is an issue of highest importance for fi nancial modeling in general and MVO in particular.
Basic assumptions on market prices behavior are required to perform a testing of asset pricing models, to
optimize portfolios by computation of risk/return effi cient frontiers, to assess derivatives and determine
the hedging strategy over time, as well as to measure
and manage financial risks. However, neither economic nor statistical theory appears to succeed in
determination of exact type of returns distribution.
Thus, distributions used in empirical and theoretical
research are commonly derived from an assumption
or estimation of data used. The overall belief adopted
in fi nances is that this is the normal (Gaussian) distribution.
Although returns normality is the standard in fi nancial modeling, some alternatives have been also
considered mainly due to evidence that the Gaussian
distribution tends to underestimate the weight of the
extreme returns contained in the distribution tails as
well as the returns fallen around the mean. For example, Longin (2005) noted that during the stock
market crashes (such as in 2008) daily market drops
can exceed 20% that can hardly be explained within
normality universe. In response, several other distributions have been proposed by the scholars, who
tried to apply them, however without evident success:
a mixture of Gaussian distributions, stable Paretian
distributions, Student t-distributions and the class of
ARCH processes. Main shortcoming of all these alternatives is that they are not nested and their adequacy
Review of Business and Economics Studies

Volume 3, Number 2, 2015

therefore cannot be directly compared, for example,
by a likelihood ratio test.
On the other hand, MVO’s intended outcome is
to fi nd an optimal portfolio that means to maximize
investor’s utility function. In case this utility function is not quadratic, but generally represented with
any upward concave form, expected utility function
should depend on the portfolio return’s values only.
Such distributions must be the two-parameter ones,
i. e. should be fully explained by their fi rst two moments — mean and variance, which are also implied
to express the higher order moments, e. g. skewness
and kurtosis. Several distributions, such as the normal, lognormal, or gamma ones satisfy this criterion
well. However, with respect to the problem of portfolio optimization, the distribution in question should
also satisfy one more criterion. Portfolio optimization
deals with a universe of assets (or other portfolios),
and an investor selects which assets to include into
portfolio. Thus, all portfolios composed by combination of individual assets must also follow some distribution that can be fully explained by their means and
variances. The distribution therefore must comply
with a criterion that both individual assets’ returns
distribution should depend on just their mean and
variance, and the distribution of returns of a portfolio (combination) of these assets meets the same requirement. The only distribution that is suitable to
comply with it and has fi nite variance is the normal
Gaussian one.
As a result, the paradigm in fi nance is that MVO
can be successfully applied only provided asset returns follow the normal distribution that is determined by its two first moments, means of returns
and their variances. The third and fourth moments of
distribution, that are, in particular, the skewness and
kurtosis can be also theoretically added to the utility
to refl ect and explain a non-normality of returns, but
it is believed that skewness is close to impossible to
predict and the predictability of kurtosis is considerably limited, either.

INTRINSIC TIME

MVO is intended to answer a very natural question:
if the exact parameters are known, which portfolio
maximizes the expected return for pre-specifi ed level
of risk, or which portfolio minimizes the risk for prespecifi ed rate of expected return? This would be all
the investor would need to have an optimal portfolio
and be happy enough with it. However, among others,
the issues described above bring some bitter stuff into
reality. "Exact parameters" that are needed ad hoc,
proved to be uncertain, noisy and lead the optimizer
to unstable results with underestimated risks.

However, it becomes evident the main problem for
all these issues is that asset returns are not normally
distributed. This is a reason why the investor cannot
accurately estimate expected returns, has problems
with unstable solutions, rebalancing, and hence with
overtrading and other bad things. Realized returns
values refrains the investor from a clear view of true
normal distribution that exists in the market, but is
hidden by noise. It is widely assumed that this is the
way things are, and for the purpose of this work, in
particular, it is implied as a true.
Based on inherent normality of returns distribution, most of the scholars propose various approaches
how to adjust realized market returns to suit Gaussian framework by introducing new parameters that
make the models more and more complicated. At
some extent, it becomes evident that many of such
sophisticated models perform worse than simplest
naïve portfolios, and hence are discarded. But one
point remains unchanged: the source data is taken
from the market and then is converted into returns
addressed for statistical manipulations.
On the other hand, it is known that the proximity
of returns distribution to Gaussian normality is not
stable over different time intervals and commonly increases with decrease of the frequency. For example,
the distribution of monthly returns is closer to the
normal one than that of days, hours or minutes. The
cause is deemed to be that the higher time intervals
have relatively lower proportion of noise within the
returns, but anyway it is obvious the proximity of returns distribution to the normal on depends on time.
It fl ows constantly by seconds, minutes, etc. And it
is also obvious, but not for the market! One minute
at the middle of trading day is not the same as one
minute right before it is being closed. Hence, a question: how can one consider all time spans during the
day in the same manner? This understanding may
explain (at least partially) the non-normality that all
involved have got accustomed to observe.
Next question is what can be used to measure this
difference in the same intervals of time, or to tick
market intrinsic time clock. Volatility is usually higher during periods of active trading (when our time
should go "faster") and, conversely, is lower over nonactive trading ones (when our time goes "slower"). But
it is not so easy to estimate it independently, and its
value represents the situation non-equally depending on volumes traded, that seems itself to be much
more interesting to implement. Traded volumes can
generally refl ect the level of market activity and this
parameter is usually available as provided among
common market data.
The bars can be now formed as based not on astronomic time interval expiration (end of second,
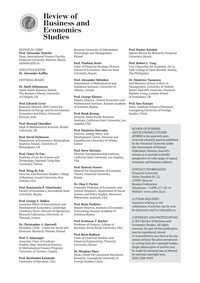
Review of Business and Economics Studies

Volume 3, Number 2, 2015

minute, hour, etc.), but when the traded volume
achieves certain pre-set value since last closed bar
formed by the same method. It can be considered as
market intrinsic time. Such time dimension — cumulative volume bar (referred hereinafter to as "CVB"),
will not coincide with astronomic time, but is expected to better refl ect the nature and the mood of
the market. The CVB returns are expected to achieve
closer proximity to normal distribution as much of
usual noise may prove to be in fact the messed data of
neighbor conventional (astronomic timed) bars, that
is going to disappear in case of CVB accounting for
market activity.
CVB approach as market intrinsic time can potentially provide a better solution for all of above
described issues. And the most interesting is that it
may allow to use MVO it its original form, without
complicated modifi cations and add-ons. More stable portfolios avoid overtrading, expected returns
have lower estimation errors as returns distribution
is close to the normal one, realized returns noise is
diminished.

CVB PROXIMITY
TO NORMAL DISTRIBUTION

Although the data generated by the market is believed to be normally distributed, it is full of noise
that prevents investors from gaining benefi ts associated with this normality. The proportion of such disturbances, however, in overall price movements tends
to decrease along with increasing of time intervals
size taken for consideration. It mainly results from
the magnitude of the market swings that are evidently bigger within less frequent intervals, while the
noise component rises slower and steadily fades out.
The returns for yearly intervals are much closer to
normally distributed data than the returns for minute
frequency. Higher intervals, however, cannot often
be useful enough for active trading and this makes
it clear that normalization of more frequent data

would be a matter of the highest interest for investors. As the returns derived from CVB are believed to
be closer to normal distributed data than the regular
ones (based on conventional astronomic time bars —
referred hereinafter to as "conventional returns"), we
have conducted a comparison of both types.
CVB concept posits that the bar is closed not
with a tick of a clock as usual, but when the volume
of trades for particular asset achieved certain preset
value. Thus, such intrinsic time is individual for every
asset as particular trading volumes are believed impossible to coincide across the market. To fulfi ll an
experiment we have taken one minute data for a period of one year 2013 for top ten assets of Russian
stock market1 and have compared the proximity to
normal distribution for the returns generated by conventional bars data and CVBs.
CVB composition is performed as iterations
for trading volumes increasing from 100,000 to
40,000,000 with a step of 100,000. For every asset,
one minute bars volumes from original source data
files are added up until the sum achieves the value
of current iteration. Then the current CVB is considered as closed, and the loop starts the same routine
for next CVB. Any next iteration obviously produces
less bars than the previous one as it collects more
conventional bars to achieve increased target volume, i.  e. generates higher intervals that may itself
bring the results closer to normality. To offset this
infl uence and to assess the contribution of the very
CVB concert rather than the benefi t of a scale, we also
generate conventional bars of similar range. When
any iteration if fi nished, it brings the fi nite number
of CVBs generated. Dividing original source data fi le
length by this number we can obtain the number of
conventional bars in the interval that corresponds
to one newly generated CVB. Then we compose new
conventional bars dataset relevant to this particular

1 Data is available at: http: //www. fi nam. ru/analysis/profi le041CA00007/, [accessed 25 February 2015].

Figure 1. Deviation of observed returns from normally distributed data.
Review of Business and Economics Studies

Volume 3, Number 2, 2015

CVB set and compare proximity to normally distributed data with the same mean and standard deviation
for both generated datasets.
Figure 1 presents the results for common shares
of GAZP (Gazprom) and SBER (Sberbank). Other assets examined provide similar pictures. Deviation
from normal distribution diminishes with interval
rise for returns based on both conventional bars and
CVBs, but the latter present higher rate and gets
times lower in the left part of the charts. By the end
of iterations the conventional returns row tends to
reach CVB ones, although CVBs still provide lower
values within the range of observation.
As a result we may posit that CVB approach allows obtaining returns that are closer to normally
distributed than the conventional bars. This advantage becomes specifi cally evident on smaller time intervals, but proceeds even further, although not that
dramatically. The application of CVB may encounter
some complexities stemmed from the fact that every
asset now exists in the market at its own time. But
this problem may be solved for practical purposes of
optimization as described below.

PORTFOLIO OPTIMIZATION USING CVB

Portfolio Theory by Harry Markowitz gives ground to
numerous mean-variance optimizers most of which
attempt to improve the method and to bypass its
known drawbacks as described above. Thus, we believe it is interesting to compare portfolio optimization by original mean-variance analysis performed on
conventional and CVB based data, as CVB brings no
modifi cation to optimization process itself, but just
rearranges the data to input. For this purpose we take
one minute interval data (also provided by Finam) for
a period from June 2008 till end of December 2014
for top ten Russian stocks. The start date was taken
that as one of the participants (particularly HYDR —
Rushydro) was listed just at the end of May 2008, and
we have no data for processing beyond this point. The

portfolio is intended to be rebalanced on a weekly or
monthly basis.
Here we encounter a problem rising from individual CVB time for each participant of our universe
to optimize. Going common way we cannot rebalance the portfolio based on CVB as the bars of all
participating assets close differently, and there is no
conventional uniform cut-off time. This issue can be
solved by several means, but we use one as follows. As
CVB is intended to arrange the data in a more natural way, there is no difference which direction such a
composition goes to. In other words, returning back
to the Figure 1 above, CVB construction performed
from the last data point backward to the first one
would produce the same result in the chart. Thus, we
can perform portfolio optimization at any point of
conventional time if constructing CVB row backward
from this point.
Similar to the way we used in the experiment on
proximity to normal distribution, at every point of
portfolio optimization we imitate conventional row
by CVBs one to compare with the most suitable. For
example, if we perform monthly optimization for
the point X of conventional data and use therefore X
months of previous data, we adjust CVB dataset accordingly. Particularly, we derive total trading volume
for each asset for whole the period till point X, and
then we divide it by X — the number of months taken
for optimization. It results in the value of average
volume per month which becomes a target volume
for CVB composition. It is defi nitely the easiest way
that does not take into account, for example, global
changes in volumes across all periods that may be
signifi cant for Russian market and can be introduced
by averages, but we leave it out of this research for
the sake of simplicity. Once we have the target value
for volume, we can construct CVBs starting from X
point. The number of CVBs is also X that is the last
point of both conventional and CVB datasets that are
now equally sized and ready for input to the optimizer.

Figure 2. Static Transition Maps.